People have many challenges working with generic databases such as DBpedia; one of them is simply understanding what data is available. The English language edition of DBpedia 2016-04 consists of 72 distinct data sets. In the Ontology2 Edition of DBpedia 2016-04 (which is currently in the review process in the AWS Marketplace) we store each of these datasets in its own named graph. By default, queries run against the union of all graphs, however, it is straightforward to write queries that consider only a limited set of graphs or that explore relationships between these graphs.
Example 10 is such a query. This query counts how many triples are shared by various pairs of graphs. We find that 48 pairs of graphs intersect one another, much less than the 2485 pairs that are possible, and even less than the 71 graphs. In fact, only 33 graphs share an intersection with another graph, meaning that slightly more than half of the the datasets do not intersect with any other dataset.
The lack of intersections can be explained because many of the data sets record different kinds of facts: for instance, one dataset contains nothing but titles, while another contains nothing but links between wiki pages. Intersections, on the other hand, mean that two graphs talk about the same subject matter from different points of view. I took the output of the Example 10 query and made a visualization with Gephi, with an initial force-based graph layout that I tweaked a bit by hand in the name of legibility:
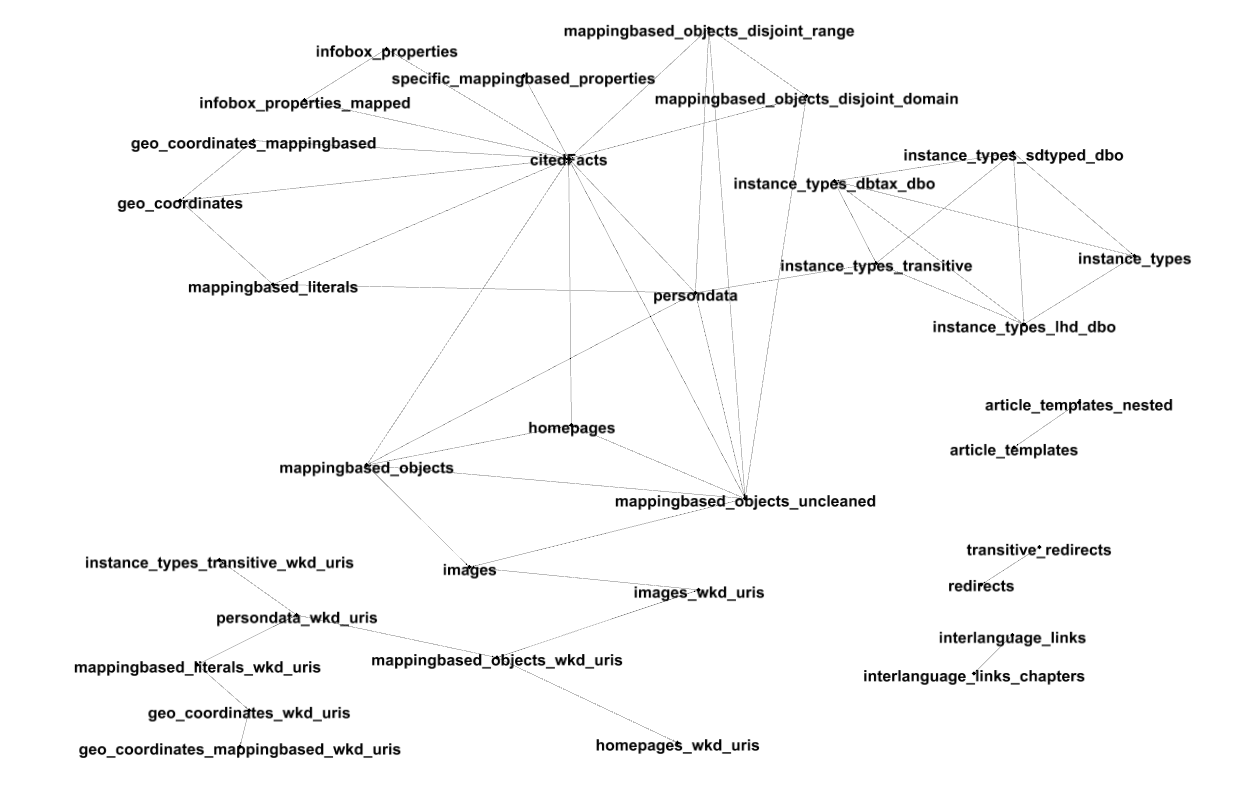
Note that there are:
What do you see? Working with DBpedia, you need to choose which datasets you want to use, and this kind of visualization is a first step towards categorizing what is there.