Overview
Different stakeholders have different concerns, but it's clear that one metric for the success of the LEI is the number of entities registered. Simply, if the parties that one does business with have LEIs, the LEI is more useful for reporting than if they don't.
The growth of LEI registrations has been driven by regulatory requirements; instead of the exponential or sigmoid growth one would expect from organic growth, the growth has come in a number of spurts:
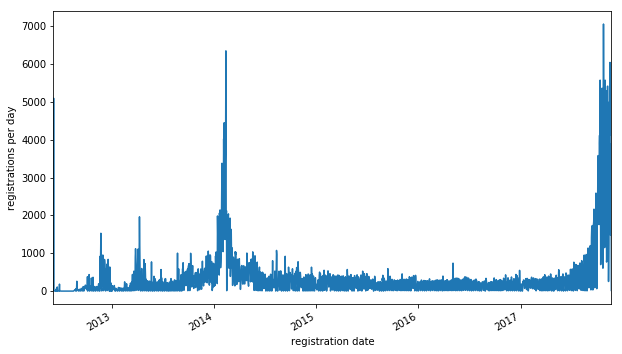
The spurt in 2014 was driven by regulators in the US. The most recent spurt, which we seem to be past the peak of, is driven by MiFID II in the European Union.
“After January, no LEI means no trade. MIFID II is not a carrot but a hammer.”
-- Chris John, HSBC Security Services
In this essay I use some "off-the-cuff" modeling to estimate how many entities will register for an LEI in respons to MiFID II and also get some insight as to the timing:
Checking the data
When I downloaded a recent data dump from the GLEIF I noticed a sharp recent drop in registrations. One possibility was that we had just passed the peak of registrations, but I was still concerned that the drop-off could be an artifact of the data. What if there was time delay between the registration date in the LEI records and the time that registrations apear in the concatenated file?
To check for that, I looked at both the Oct 1, 2017 and the Nov 21, 2017 dump files.
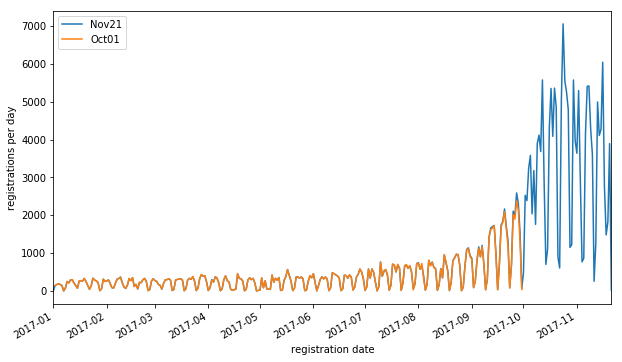
The orange and blue curves overlap almost perfectly; it seems that a handful of records may be delayed by a few days, but time delays can't explain the drop in registration in the last few weeks.
Speaking of weeks, note that very few LEIs are registered on weekends, causing a strong 7-day periodicity in the data. If I had to point out a weakness in this analysis, it is that I've made no effort to model this periodicity -- the least squares fit I use does this best it can despite this, but it results in a much higher chi square error which makes it hard to compare different models rigorously.
Fitting Curves
Theory
The theory behind this is that of the Diffusion of Innovation; the observation that whenever people adopt a new social or technological innovation, the time rate of adoption looks a bit like a bell curve:
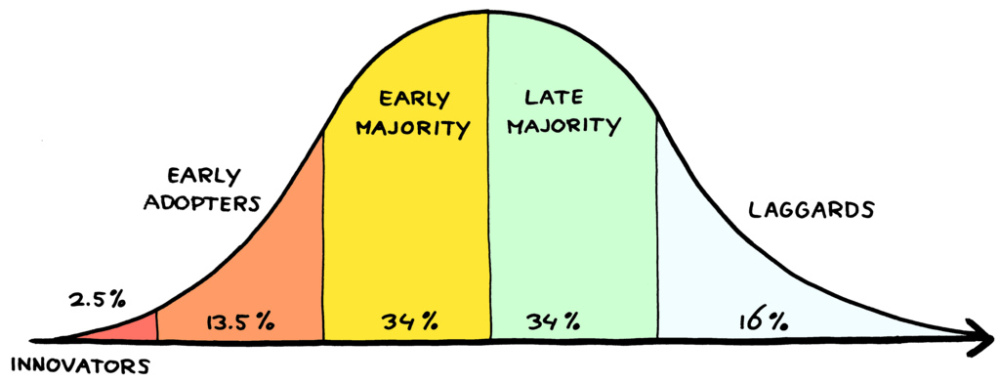
There are a few ways to justify this. The Verhulst equation is a differential equation that models a competition between exponential growth (at early times) and resource constraints (at late times.) The result of this, expressed as a cumulative distribution function, is the Logistic Function, and if we plot the time rate of that function it looks a bit like a bell curve.
A statistician on the other hand, might see normal distributions everywhere, and justify the use of the normal (Gaussian) distribution on the basis that these are widespread because the limit of a large number of interacting additive processes converges towards a Gaussian.
In practice, fitting a curve of this general nature often gives good predictive results in this sort of situation, even when working before the peak.
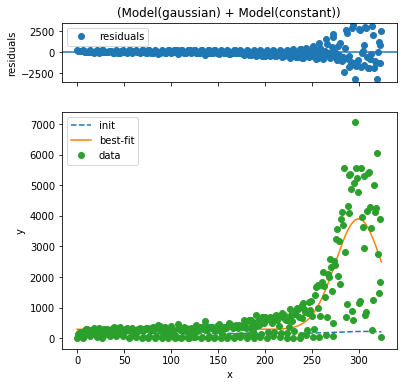
Try 1: Gaussian model
I use the lmfit package to fit a simple model to the data. My assumption is that the data consists of two components:
- a constant rate of background registrations
- a Gaussian-shaped pulse of MiFID II registrations
This model can be constructed by just adding two models built into lmfit, which then does the non-linear fit:
The fit curve is pretty good, but the weekly periodicity is a distraction from eyeballing the fit. To address that, I plot the cumulative sum of both the actual and estimated registrations from Jan 1, 2017 onward.
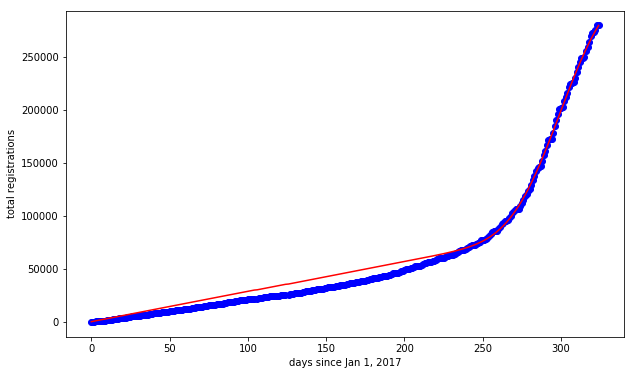
This doesn't look quite so good. Pretty clearly the model assumes the background registration is too high and also assumes the peak is too concentrated in time; that is, the distribution of registration dates has "fat tails" compared to the Gaussian
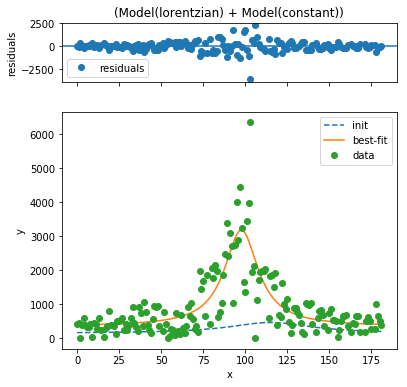
Try 2: Lorentzian Model
The Lorentzian Model also known as the Cauchy Distribution is a common probability distribution with "fat tails." I remember it fondly from my days as a physics grad student, because it describes the shape of all sorts of spectral lines. It's built into lmfit, so it is quick to fit:

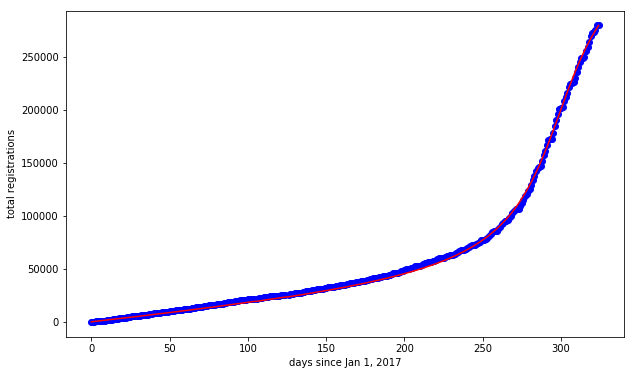
The plots generated by lmfit look almost the same, but the cumulative registration plot looks much better with the Lorentzian model -- it's clear that it does a much better job of modeling both the peak and the background.
Total Registrations: Area Under Curve
The predicted number of MiFID II registrations is the area under the peak; for the Lorentzian model, this is
and for the Gaussian model
This is a substantial difference between these because the Gaussian model attributes more registrations to the background, and fewer than the peak, see this comparison:
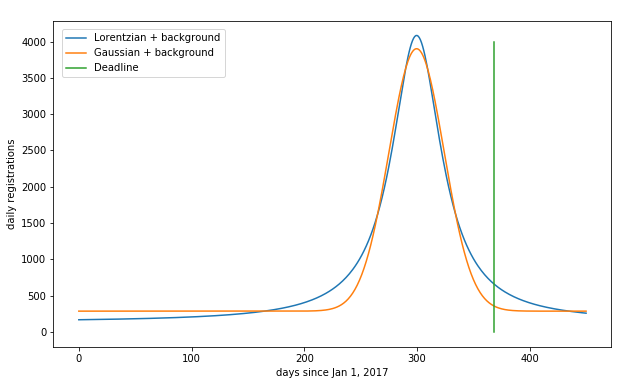
I'm inclined to believe the Lorentzian because it more correctly models the background.
Percent Late
In any rush like this, some people show up late. As seen above, the Lorentzian and Gaussian models make radically different predictions for this. The Gaussian model predicts that only a tiny fraction of registrations will be late, while the fat tail of the Lorentzian results in a much higher rate of late registrations.
To zoom in on the Lorentzian (and leave out the background) we see:
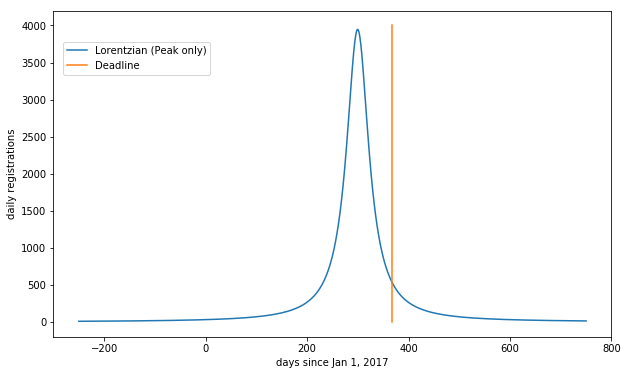
Counting the predicted registrations after the deadline, I find that the following percentage wind up late:
Total registrations on the deadline
Now, to test these predictions could be tricky because many of the variables (MiFID II registrations, % late) are not directly observable. What is observable, however, is the total number of registrations on January 3, 2008, which can be made by adding up the area under curve for both the background and the peak. With the Lorentzian, my prediction is
and with the Gaussian I would predict
Unlike the prediction for the number of MiFID II related registrations, these two predictions are close, within less than 1%. The Lorentzian and Gaussian model largely agree about the number of registrations, but because of the different tail widths, they disagree about the size of the peak relative to the background.
Bonus analysis: Winter 2014
U.S. regulators imposed a similar deadline in Winter 2014. It's an opportunity to give this model another tryout:
The fit seems to be pretty good. I estimate that roughly 108,000 registrations were driven by this mandate. Interestingly, the sigma parameter, which measures the width of the curve, is 12.2 days for the case of the US peak as opposed to 26.5 for the EU peak, indicating that the process in the US happened roughly twice as quickly.
Conclusion
The diffusion of innovation model makes not only qualitative but also quantitative predictions that are often highly accurate -- reducing the excuse for being blindsided by trends.
Applied to LEI predictions, I forsee 330,000 LEI registrations driven by MiFID II, and a total of 809,000 LEI registrations by the January 3, 2008 deadline for "No LEI, No Trade" in the EU. I expect that roughly 13% of "laggards" will miss the deadline.
Let's see how it turns out!